I promised I’d dig a bit deeper into the book data, so here goes!
We have seven academic schools in the university, so I thought it would be interesting to see how the range of titles broke down by each school. As previously noted, the borrowing patterns seem to have changed at the end of 2005/start of 2006, so here’s the percentage change for the two periods…
academic school       average range of titles borrowed    % change
                            2000-2005        2006-2008
Music, Humanities & Media      16,760           20,468      122.1%
Business                        9,431           11,402      120.9%
Computing & Engineering         7,033            6,771       96.3%
Education                      12,485           11,909       95.4%
Human & Health Sciences        16,427           20,274      123.4%
Applied Sciences                7,356            7,562      102.8%
Art, Design & Architecture      9,361           12,309      131.4%
So, first of all, the increase in range of titles being borrowed isn’t across the board. I knew Computing & Engineering borrowing had been in decline for a number of years, but I’m surprised to see that the same applies for Education. Applied Sciences has stayed pretty much the same, but the other 4 schools have seen sizeable increases in the range of titles being borrowed.
The Art & Design section of the library was revamped in 2005, so it could be that we’ve seen an increase in the number of students using the library and that has driven the increased borrowing since then for that school.
A few of the comments suggested that loans per borrower would be a useful metric. Unfortunately I don’t have the data for the total number of students in each school per year, so I’m using the total number of active borrowers instead…
academic school      average loans per active borrower    % change
                            2000-2005        2006-2008
Music, Humanities & Media        26.1             25.7       98.6%
Business                         10.2             12.3      121.4%
Computing & Engineering           8.3              7.7       93.6%
Education                        15.1             14.0       92.8%
Human & Health Sciences          15.3             18.8      122.6%
Applied Sciences                 11.8             13.3      112.1%
Art, Design & Architecture       10.6             10.4       98.4%
Again a decline in Computing and Education. Art & Design and Music & Humanities have remained pretty much the same. The other 3 schools have seen an increase in the number of loans per active borrower.
One final set of data — the number of active borrowers per school…
academic school    average active borrowers per school    % change
                                2000-2005    2006-2008
Music, Humanities & Media           1,537        1,976      128.5%
Business                            2,557        2,963      115.8%
Computing & Engineering             1,650        1,527       92.5%
Education                           1,526        1,988      130.3%
Human & Health Sciences             3,587        4,581      127.7%
Applied Sciences                    1,267        1,243       98.1%
Art, Design & Architecture          1,621        2,332      143.9%
It looks like there are a couple of things going on here…
1) In the last 3 years, the number of active borrowers (i.e. users who have borrowed at least one item) has increased. In the period 2000-2004, the total number of active student borrowers was relatively static (around 14,000) and since 2005 it’s been on the increase (with just over 17,000 in 2008).
2) Overall, there’s an increase in the average number of books borrowed per active borrower, primarily driven by the two schools with the highest number of active borrowers (Business and Human & Health). The increases in those two schools more than offsets the decreases seen in a couple of the other schools (Computing and Education).
At a time when some other UK academic libraries have reported a decrease in borrowing, both of the above are good news for our library. I’ll need to go back to the SCONUL stats to check, but I don’t think we’ve seen much of an increase in book stock in the last decade (I suspect it might actually have decreased).
So, can we actually say anything about the impact of serendipity? If we look in more depth at the average number of books borrowed per active borrower per year for all students, we get this…
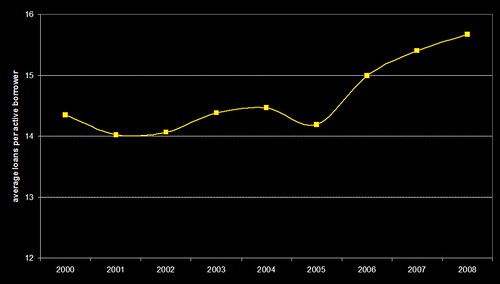
…which closely resembles the original graph from the first post showing the range of unique titles borrowed per year…
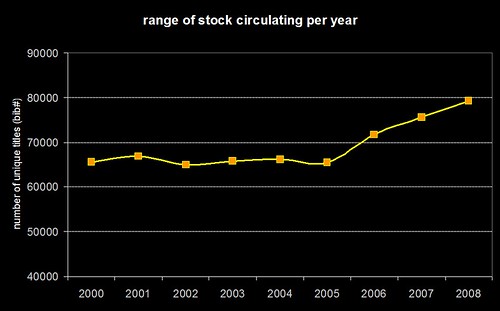
…and the number of active borrowers per year also shows a similar trend…
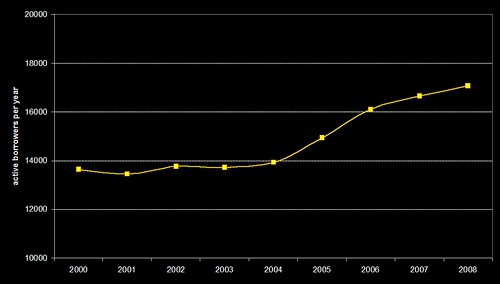
It’s obvious that there’s a driver in there somewhere which has caused the average number of loans per active borrower to increase since 2005. Hand-in-hand there’s been a similar increases in the range of stock that’s being borrowed and the number of active borrowers.
As more people use the library, one would perhaps expect the range of stock being borrowed to increase. However, would you also expect the average number of loans per borrower to increase (bearing in mind that the stock levels have probably not increased and may have actually decreased during that period)?
I’m still not entirely sure I’ve shown that adding serendipity to an OPAC increases the range of stock being borrowed (that’s probably more influenced by the number of active borrowers), but there may well be a link with the average number of books loaned to each borrower.
Now, to change the topic, here’s one final graph that I included in the UKSG presentation — it shows the number of clicks per month on the books in the OPAC’s virtual shelf browser…

…seeing as this was just an experimental feature that added a bit of “book cover eye candy” to the OPAC, I’m amazed how heavily it’s being used. Whilst fixing one of our dedicated catalogue PCs in the library on Friday, I noticed that a student was carrying out a search, then picking a relevant search result, then using the shelf browser to look at all of the nearby books. And to think I’m usually dismissive of the benefits of browsing within OPACs 😀
I think the ‘serendipity’ case gets stronger, don’t you?
Browsing/virtual book shelves, especially for those Humanities and Arts students, is where it’s at. I know this from many years of personal experience teaching and researching in the humanities. Digging in the stacks. Would have loved to have seen what ‘people like me’ borrowed, and like Tony Hirst, wondered who the person was who kept recalling my (MY) books. Yes, I was less charitable — but maybe because this ‘person’ was anonymous, and clearly writing MY PhD;-)(less charitable, and perhaps a tad paranoid, but don’t under-estimate the paranoia of academics! Scholarly profiles on an OPAC perhaps a risky prospect for this demographic?)
Looking at recommendations (or ‘people who borrowed this also…) is a form of browsing, wouldn’t you say? Just another form of aggregation.
The interest in the bookshelf doesn’t doesn’t surprise me, but it’s exciting to see the numbers here.
I’ll do some analysis on the books that were clicked on from the bookshelf to see if there was a stronger bias to specific subject areas.
For those are who interested in usage figures, it might be worth repeating some of the comments from the UKSG presentation…
slide 79: This shows the average number of loans per month. You can see we get peaks in October (i.e. just after the start of the new academic year) and around Easter.
slide 80: Average number of clicks per month on “did you mean” spelling suggestions. In terms of usage, this is the most heavily used thing we’ve added to the OPAC. In presentations, I use this slide to argue that if you’re only going to invest time/money/effort into adding one new feature to your OPAC, then add a spellchecker.
slide 81: The average number of clicks per month on the “people who borrowed this…” suggestions. Note that it peaks in November — that’s when the largest amount of material is out on loan. The data seems to suggest that when material isn’t available, students are more likely to use the serendipity links to find other relevant material.
slide 82: The virtual shelf browser hasn’t been in place for a full year yet, so the data is incomplete. However, it’s already getting nearly as much usage as the spellchecker!
slide 83: We had some “dead space” on the front page of the OPAC, so we added a keyword cloud to show what the most popular keyword searches have been over the last couple of days. The usage isn’t high (up to 1000 clicks per month), but note how peak happens in October. In late September and throughout October, the library is teeming with new students who’ve never used our OPAC before. That peak of usage seems to indicate that the keyword cloud is a useful tool for “newbies”. Clicking on a keyword that’s relevant to their subject area is perhaps easier than trying to think of a book to search for and it’s possibly a good way of getting them using the OPAC for the first time?
I’ve seen big claims of impact of initiatives on user behaviour made on much shakier ground than this 🙂
OK – so you are never going to be able to isolate all the factors here, but you can show a number of linked trends, and the use of the OPAC enhancements for serendipitous browsing are one of those trends.
I’m thinking that the correlation is, the OPACs may still suck, but if they suck less, they will get used more. You are engaging them with color and more options should the search be less-than-optimal.