…sorry, but that was the best blog title I could come up with at 10pm after a long day 😉
In a previous post, I mentioned that the circulation figures were up for the year so far (when compared to 2006). That got me wondering what the long term trend was for items checked out. Unfortunately there are some sizeable gaps in the historical data (as stored on Horizon), otherwise I’d be able to go back as far as 1996.
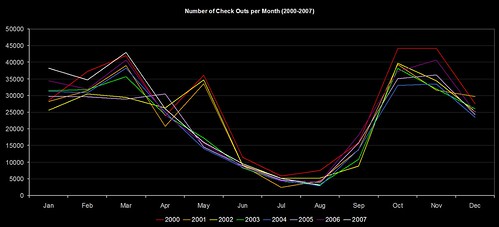
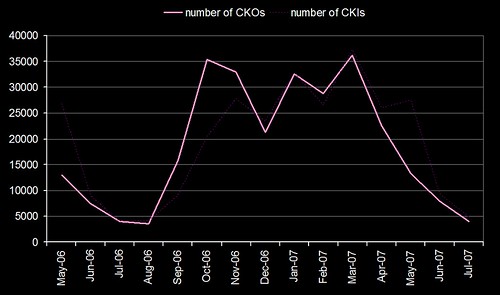
Anyway, here’s how the number of check outs per month pans out since 2000…
…or if you prefer your lines to be smoother…
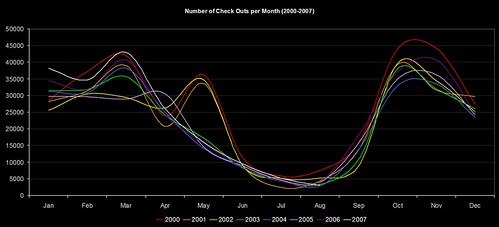
The CKO data for this year is in white.
There’s a marked change after 2002 in the period around May, and (if memory serves me right) the structure of our academic year changed in September 2002. The overall figures indicate that we had a slight decline around 2003, but it’s been climbing gradually since then. So, much as I’d love to take the glory for our increased CKOs this year, it’s probably just following the recent trend.
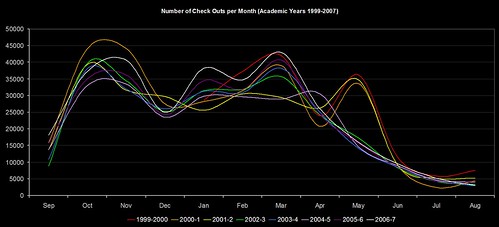
Finally, here’s the same graph, but adjusted for an “academic year” (Sep-Aug)…
Category: Huddersfield Uni
If you build it, they’ll come back for more!
I’m just busy putting together slides for some of the upcoming presentations and I thought it was about time I trawled through some of the OPAC usage stats to see if our students are still using some of the OPAC tweaks we’ve made.
The good news is that they are, and then some more!
First up, here’s the overall usage for 4 of the tweaks (May 2006 to July 2007):
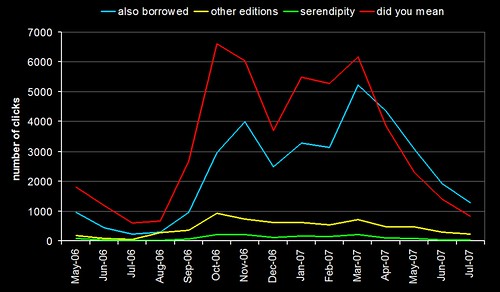
At first glance, nothing too surprising — the overall trend follows the academic year, with the lull over summer.
What did leap out was the blue line (clicks on “people who borrowed this, also borrowed…” suggestions) — since this April, the usage has been higher than the “did you mean” spelling suggestions (red line). So, either our users have suddenly become better spellers, or they’re making much higher usage of the borrowing suggestions. If I was a betting man, I’d say it was the latter.
We’ve now got enough data to compare the same 3 months in 2006 and 2007 (May to July):
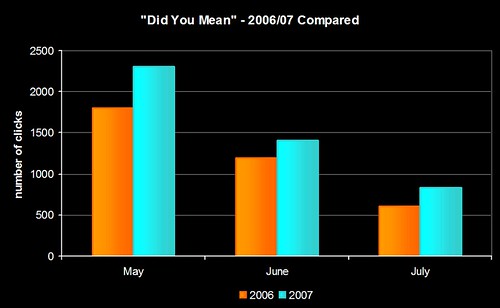
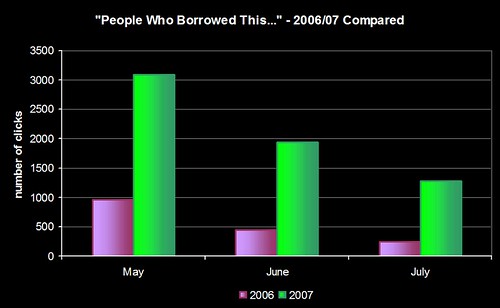
That second graph is why I’m sat here with a grin like a Cheshire Cat 😀
[update]
I’ve dug out the circulation stats for the same period and that re-inforces the statement that the students are making much higher usage of borrowing suggestions in 2007 than in 2006. You can see that the number of check outs (bold pink) pretty much matches the number of clicks on the “did you mean” spelling suggestions (red line in the first graph). Check outs have also risen in 2007 when compared to the same months in 2006.
Interestingly, I don’t think we’ve ever had a student go up to a member of staff and say “I’ve found the suggestions really useful” or “thank you for adding spell checking”. I wonder how many complaints we’d get it we turned the features off?
More Solr fun
Darn, I should have known I was following in a great man’s footsteps…
http://www.code4lib.org/2007/durfee
Anyway, a couple more hours of coding has resulted in this…
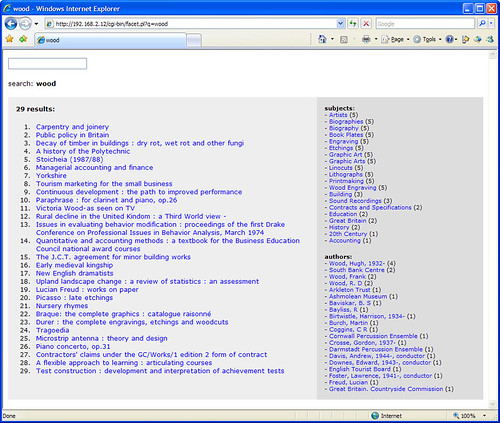
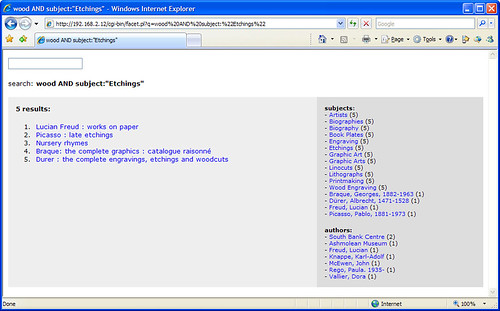
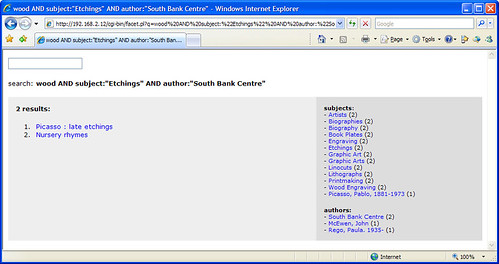
http://161.112.232.18/modperl/facet6.pl?q=medicine
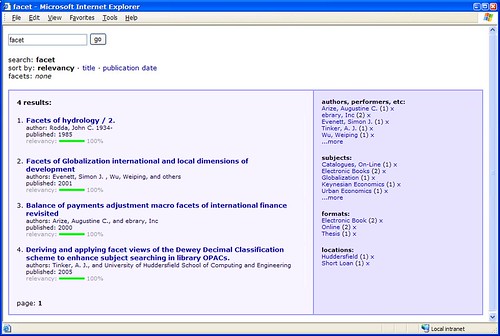
Hopefully NCSU won’t be setting their lawyers on me (copying is the most sincere form of flattery!), but the prototype has certainly borrowed one or two ideas from their wonderful OPAC.
It’s still a way off being a full OPAC replacement and I need to shrink the book covers down to a more sensible size, but I’m quite chuffed with what I’ve been able to achieve in just a few hours of coding.
Solr + 2 hours = faceted OPAC
I’ve been meaning to have a play around with Solr, which is…
an open source enterprise search server based on the Lucene Java search library, with XML/HTTP and JSON APIs, hit highlighting, faceted search, caching, replication, and a web administration interface
It’s mostly the “faceted” part I’m interested in and, after a couple of hours of messing around, I’ve got a basic OPAC search interface up and running with around 10,000 records pulled in from our catalogue.
It looks like Solr automatically handles word stems, as searches for “score”, “scores”, and “scoring” find the same results. The results are also relevancy ranked, although I need to find a way to fine tune the default ranking algorithm.
All in all, I’m very impressed with what Solr can do and how quickly it handles searches.
Hey, whatcha lookin’ at?
Just for the heck of it, I’ve started logging details of the full bib pages displayed in the OPAC to get a feel for what are the most looked at books. Once we’ve got enough data, it’ll be interesting to cross reference that with the actual number of physical copies we own for each title and whether or not a copy was checked out shortly after it was looked at.
In the meantime, here’s another “wall of books” to feast your eyes on…
top 50 most looked at books on the OPAC in the last 7 days
(I don’t have 7 days of data yet, but not to worry!)
Heh – glad to see the following funky book made it into the initial top 50 🙂

“Spooky” and “Eureka!” moments
Just spotted “Asking Non-Users Why They Don’t Use the Library” (LISNews):
From the Newtown (CT) Bee, C.H. Booth Library is looking for opinions about the library from an unlikely source: the people who do not use it. As part of a study for long-range planning at the library, made possible through a $9,000 grant awarded in 2006 by the Connecticut State Library, consultants Kevin McCarthy, director of Perrot Library in Old Greenwich and Christine Bradley, Connecticut Library Consortium executive director, have created a survey for local residents. To date, more than 300 surveys have been returned, a return rate that Mr McCarthy said at a meeting January 9 is very good.
At Huddersfield, we’ve been busy trawling our usage stats — firstly for our initial Equality Impact Assessment of opening hours, and more recently an analysis of non and low usage by staff and students.
We’ve only done an quick overview of non-usage (specifically usage of electronic resources, library borrowing, and number of visits to the library), but it’s thrown up some interesting trends such as:
1) Art & Design Students — only 20% of them regularly use our electronic resources, but (relatively speaking) they are heavy users of the library (visits and borrowing)
2) the older you are (apparently we’re not allowed to say “Mature Students” anymore), the less likely you are to use the library and it’s facilities — the drop off rate is fairly alarming, especially as we have a large number of students who didn’t come to us straight from doing their A Levels
3) female students are more likely to borrow books than males, but are less likely to make use of the library outside of the normal 9-5 opening hours
Continue reading ““Spooky” and “Eureka!” moments”