A library dating service

In my UKSG presentation, I briefly touched on the need for library services (perhaps the OPAC, but perhaps not) to start joining users together in the same way that sites like Facebook do.
In the same way that a “people who borrowed this, also borrowed…” service starts exposing the hidden links between items on shelves, I think we need to start finding the connections between our users.
Using circulation data, we can start to locate clusters of users who’ve borrowed the same books. In an academic environment, these may be students who are studying on the same course. However, what if we discovered that two separate courses being run in different parts of the university had a strong overlap in borrowing? Would value be gained from introducing those students to each other?
No sooner had I tweeted that I was thinking about this kind of thing, Tony Hirst sent a response

…a library dating service, then? Heh heh 😉

I’m keen to know what your first reaction to Tony’s comment is!
What if you were a lonely researcher who wanted to find someone similar to yourself, in order to collaborate on a project? By mining the circulation data and/or OpenURL article access data, a library could find your ideal partner — someone who’d been looking at the same books and resources that you’d been using. If libraries were aggregating their usage data at a national level, that perfect partner could well be a researcher at another institution.
To test this out, I tweaked our “people who borrowed this” code to generate the links between users (rather than the books). As an aside, I’ve been trying all day to figure out what the user equivalent of “people who borrowed this, also borrowed…” is, but haven’t been able to wrap my head around the logical linguistics of it!
Data Protection obviously means that I can share that prototype with you, but it did throw up some interesting results. For my partner Bryony, her closest match was one of her colleagues who works in the same department as her — they both share similar craft related interests, so have borrowed similar books. However, what if her closest match was someone working in another department? Maybe they’d want to meet up over a coffee and swap crafty ideas.
I also tried the same for one of my colleagues, who’s a lecturer, and found that his ideal match is himself! Or rather, the closest match for his current library account (as a member of staff) was his old library account from when he was a student. In other words, since becoming a lecturer, he’s re-borrowed quite a few of the books he used as a student.
Although I can’t show you the data for individuals, we can step back a level and look at the borrowing at the course level. I’ve put together a quick and dirty prototype to play with. The prototype will pick a course at random and then show the courses that have the closest matches in terms of book borrowing — if you’re unlucky and get an empty list (i.e. no matches were found), try refreshing the page.
Taking the BSC Applied Criminology course as an example — 59.3% of the books borrowed by students on that course were also borrowed by students on the BSC Behavioural Sciences course (HB100). The other top matches all seem to be related to criminology: psychology, social work, police studies, child protection, probation work, etc. However, there also appears to be some synergy with books borrowed by midwifery, history and hospitality management students.
I’ll try and add some extra code in tomorrow to show what the most popular books are that inhabit those course intersections.
The impact of book suggestions/recommendations?

Whilst finalising my presentation for the 2009 UKSG Conference in Torquay, I thought it would be interested to dig into the circulation data to see if there was any indication that our book recommendation/suggestion services (i.e. “people who borrowed this, also borrowed…” and “we think you might be interested in…”) have had any impact on borrowing.
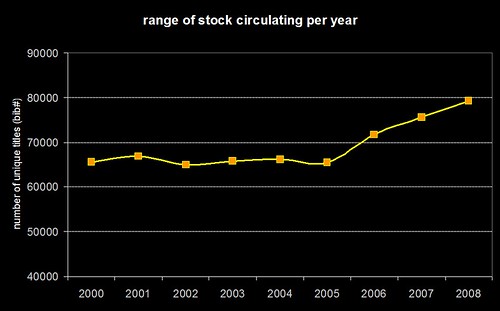
Here’s a graph showing the range of stock that’s being borrowed each calendar year since 2000…
interesting
Just to be clear — the graph isn’t showing the total number of items borrowed, it’s the range of unique titles (in Horizon speak, bib numbers) that have been borrowed. If you speak SQL, then we’re talking about a “count(distinct(bib#))” type query. What I don’t have to hand is the total number of titles in stock for each year, but I’d hazard a guess that it’s been fairly constant.
You can see that from 2000 to 2005, borrowing seems to have been limited to a range of around 65,000 titles (probably driven primarily by reading lists). At the end of 2005, we introduced the “people who borrowed this, also borrowed…” suggestions and then, in early 2006, we added personalised “we think you might be interested in…” suggestions for users who’ve logged into the OPAC.
Hand on heart, I wouldn’t say that the suggestions/recommendations are wholly responsible for the sudden and continuing increase in the range of stock being borrowed, but they certainly seem to be having an impact.
Hand-in-hand with that increase, we’ve also seen a decrease in the number of times books are getting renewed (even though we’ve made renewing much easier than before, via self-issue, telephone renewals, and pre-overdue reminders). Rather than hanging onto a book and repeatedly renewing it, our students seem to be exploring our stock more widely and seeking out other titles to borrow.
So, whilst I don’t think there’s a quick any easy way of finding out what the true impact has been, I’m certainly sat here with a grin like a Cheshire cat!

Mash Oop North

Coming this summer…
mashuplibrary2009
We’re hoping to fix the date soon, but it’s likely to be on or around Tuesday July 7th at the University of Huddersfield.
If it is July 7th, then we’d be able to celebrate:

…that both events occurred on July 7th is not a coincidence 😉
(mashed potato courtesy of jslander)

Mashed Libraries — “Mash Oop North”?

I’ll try and make some time to blog about the excellent dev8D event, but on Thursday morning I had a chat with Owen Stephens about running a Mashed Libraries event in Yorkshire.
Earlier on in the week, the name “Mash Oop North” sprang into my head[1]. With a name like that, it’d be rude not to run an event 😀

(Mash and Gravy by chotda)
So, would anyone be interested in attending an event hosted in Huddersfield (or perhaps somewhere else in Yorkshire)? I’ve posted a comment on the Mashed Libraries forum with more details about travel links to Huddersfield. Please post a comment here or on the forum to say “yay” or “nay”!


[1] “oop north” is fairly common slang for “up north” (i.e. the North of England), as in “it’s grim oop north

It’s raining squirrels

Squirrels falling out of the sky isn’t something that’s unheard of in Huddersfield — see this BBC News story about an inventor who suffered whiplash from a falling squirrel — but I’d not seen it happen until yesterday.
Late yesterday afternoon, we ventured out into the snow and had a little wander through the local woods. I’d taken my camera with me and, not too far into the woods, I took this photo of the path…
ADSC_6808
My camera’s set up to do a “burst” of shots, so it automatically took another 3 photos in quick succession. Just as I was taking the first photo, I was aware of a noise in the tree tops — what I didn’t realise was it was the sound of a squirrel falling 😀
The next shot caught the squirrel in mid-fall, although it’s just a blur in the middle of the frame…
ADSC_6810
…it had a soft landing in about 9 inches of snow…
ADSC_6811
…and then headed straight back up the nearest tree…
ADSC_6812
…within seconds it was leaping around the tree tops like nothing had happened…
ADSC_6829

3 Million

Aaron’s cool Wordle visualisations prompted me to have a look at our ever growing log of OPAC keyword searches (see this blog post from 2006). We’ve been collecting the keyword searches for just over 2.5 years and, sometime within the last 7 days, the 3 millionth entry was logged.
Not that I ever need an excuse to play around with Perl and ImageMagick, but hitting the 3 million mark seemed like a good time to create a couple of images…
file6_good
file7_good
The only real difference between the two is the transparency/opacity of the words. In both, the word size reflects the number of times it has been used in a search and the words are arranged semi-randomly, with “a”s near the top and “z”s near the bottom.
If I get some spare time, it’ll be interesting to see if there are any trends in the data. For example, do events in the news have any impact on what students search for?
The data is currently doing a couple of things on our OPAC
1) Word cloud on the front page, which is mostly eye candy to fill a bit of blank space
2) Keyword combination suggestions — for example, search for “gothic” and you should see some suggestions such as “literature”, “revival” and “architecture”. These aren’t suggestions based on our holdings or from our librarians, but are the most commonly used words from multi keyword searches that included the term “gothic”.
..and, just for fun, here’s the data as a Wordle:
wordle2
wordle1

ITV Unforgiven – campus shots

Following on from the last blog post, here’s some of the “on-campus” photos…
snapshot20090128182906.jpg
(that naughty faked “York” signage)
snapshot20090128183817
(Quayside, staged to look like a student cafeteria)
snapshot20090128184323 snapshot20090128184333
(The Art & Design section of the Main Library — apparently the few seconds of footage that appeared in the final programme took 3 hours to shoot!)
snapshot20090128184210
(St Paul’s Hall — a venue that attendees of the world famous Huddersfield Contemporary Music Festival will be familiar with)
snapshot20090128183905 snapshot20090128184223
(outside the Creative Arts Building — the foundation stone was unveiled by The Queen in 2007)
snapshot20090128184014
(inside the Creative Arts Building, with St Paul’s Hall in the background)
snapshot20090128184155 snapshot20090128184342
(Storthes Hall, student accommodation)

Hey up — we’re on TV!

The last episode of “Unforgiven” (IMDB) has just finished, and it featured quite a bit of footage filmed on-campus at the University of Huddersfield — mostly in the new Creative Arts Building, opposite the library…
floor6_017
However, if you watched the programme, you probably spotted that the TV production crew covered up the University of Huddersfield signage and replaced it with “University of York”. They even used the same font and design as York!!!
I’m not sure if there’s anyone from York reading this blog, but I’m curious to know what exactly happened. Presumably the University of York gave the production company permission to use their corporate branding? If so, why didn’t they just do the filming at York in the first place? I’m also surprised that the top brass at Huddersfield gave the production company permission to dress our University as another one — especially one that wasn’t a fictional university :-S
Anyway, if you did watch the final episode, the parts where Ruth Slater (played by Suranne Jones) followed her sister (Emily Beecham) to the university were filmed at Huddersfield in the Creative Arts Building and in the Quayside area of the Central Services Building.

Talis Podcast

I can’t remember if I was using my “posh telephone voice”, but Richard Wallis has just posted a podcast that was recorded yesterday afternoon with Patrick Murray-John.
It’s definitely worth fast-forwarding past my inane waffley bits to listen to Patrick’s comments, as he makes some great points. Using usage data for marketing purposes wasn’t something that had occurred to me, but it’s a fantastic idea!
Even though it was an informal chat, I kept feeling twinges of “job interview syndrome” — that horrible sensation you get when you’re busy talking and you realise you’ve forgotten what the actual question was :-S
For my sins, I’m going to be doing something about OPACs and usage data at the upcoming JISC Developer Happiness Days event along with Ken Chad.
p.s. Can I propose a drinking game for this podcast? The rules are you have to have a drink every time someone mentions Tony Hirst‘s name ;-D